New Facebook Insights Data
Admin panel also has an Insights section. Click on the ‘See All’ link to get indepth data about your page.
(Know more here: http://ads.ak.facebook.com/ads/creative/insights/page-insights-guide.pdf)
Hot Tip:You will find the some exciting information which helps you to understand the growth of your brand on this platform.
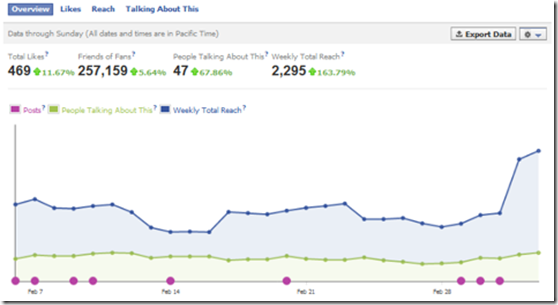
This is the main Insights dashboard and here you’ll see the total number of likes (and whether this is increasing or decreasing), the number of friends of fans available (this is the potential number of people you can reach!), how many people are actively talking about your page as well as your total weekly reach.
The number of people who like your page. This number does not include Facebook pages that like your page.
The number of people who are friends with people who like your page. This number doesn not incude subscribers of people who like your page. It definitely would have been a great addition though.
The number of people who have created a story about your page including posting to your wall, interacting with a status update (likes, comments, and shares), answering a question, responding to an event, mentioning your page in a status update, tagging your page, or checking in at your place.
The number of people who have seen any content from your page for the last seven days.
The purple bubble on the graph represents the number of posts your page has published on a given day.
Beneath the graph, you can see engagement information about your individual page posts. Columns are sort-able by date, post snippet, reach, engaged users and talking about this of each post. Virality percentage of each post is one of the most important data which can be extracted out of this section.
The default view for this section will show all of your latest posts. Click on this dropdown to see posts with photos, links, videos, or questions. You can also view the data for the other posts by clicking View other posts at the bottom.
The post column shows the beginning snippet of your post. Click on it to see a full preview.
Shows you how you reached your audience whether it was organic, paid, viral or total. This is useful because it tells you how people are finding out about your content and gives you insight as to whether or not you should consider doing Facebook Ads if organic and viral is not paying off.
-
Organic is from news feed, news ticker or from your page.
-
Paid is who saw your content from an Ad or Sponsored Story you placed.
-
Viral is the number of people who saw your page from a story that was published by a friend. This can include when a friend likes your page, likes a post, comments on your fan page wall (if you allow this type of action), sharing one of your posts and any other actions you allow on your page so their friends may see.
The number of people who have clicked on the post within the first 28 days after it was published. Click on the number to see the number of times your post generated clicks and engagement from users including likes, comments, and shares.
The percentage of people who have created a story from your page post (shares) out of the total number of people who have seen it.
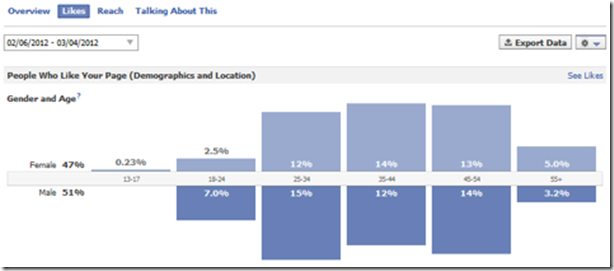
The Likes section shows you a demographic breakdown of people who have liked your page including age, gender, countries, cities, and languages.
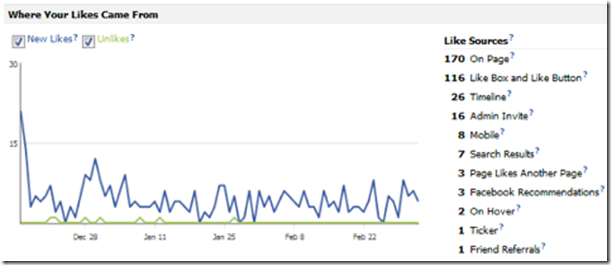
Beneath the demographics is a section that tells you where your page’s likes have come from.
Hot Tip:This is a great way to see what converts visitors into fans and keep a track on your conversion channels as well.
![]() On Page – Likes generated from your Facebook page itself.
On Page – Likes generated from your Facebook page itself.
![]() Like Box and Like Button – Likes generated from the Like Box and Like Button social plugins on external websites.
Like Box and Like Button – Likes generated from the Like Box and Like Button social plugins on external websites.
![]() Admin Invite – Likes generated from the use of suggesting a page to a friend from the Admin Panel > Build Audience > Invite Friends.
Admin Invite – Likes generated from the use of suggesting a page to a friend from the Admin Panel > Build Audience > Invite Friends.
![]() Timeline – Likes generated from people clicking on your page in a person’s personal Timeline profile Likes section.
Timeline – Likes generated from people clicking on your page in a person’s personal Timeline profile Likes section.
Likes generated from people on a mobile device.
Likes generated from people who used Facebook’s search box.
Likes generated from other pages that like your page.
Likes generated from a Recommended Pages unit in the right hand column on Facebook.
Likes generated from the popup window shown when someone hovers over a link leading to your page anywhere on Facebook.
-
Ticker – Likes generated from mentions of your page in the news ticker.
-
Friend Referrals – Likes generated from a story about someone liking your page.
Hot Tip:You can also see the number of unlikes you have on a given day. If you see a big spike in unlikes on a particular day, you should see if you posted something on your page’s wall that day and avoid similar updates.
The Reach section shows you demographics about the people you have reached through your page’s content, posts, and stories by others. Scroll down to the bottom of this section to see two important pieces of information.
![]() Total Tab Views – The number of times each tab is viewed on your Facebook page, including the main timeline itself.
Total Tab Views – The number of times each tab is viewed on your Facebook page, including the main timeline itself.
![]() External Referrers – The number of referral visits from sites other than Facebook, including any site you have included a link to your Facebook page.
External Referrers – The number of referral visits from sites other than Facebook, including any site you have included a link to your Facebook page.
The Talking about This section shows you demographics about the people who have created stories around your Facebook page. It measures these nine (9) actions: liking a page, posting (a comment, photo, link or video) to a page’s wall, commenting or liking or sharing a page’s status update, photo, video or other content, answering a question posted by a page, RSVP’ing to an event hosted by a page, mentioning the page (users must formally tag the page), tagging a page in a photo, liking or sharing a check-in deal, checking in at a place..
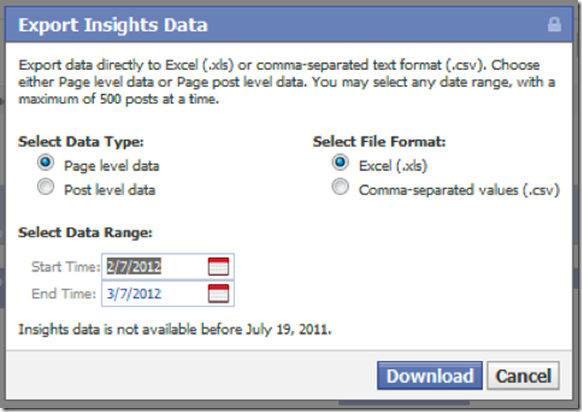
Want to see the raw data? You can export your page and post level data to Excel (.xls) and comma-separated text format (.csv).
Hot Tip:This can be helpful since most of the Insights screens will only allow you to go 89 days back. This report will include any data before the current date.


 We can design your online assets from websites to e-commerce shopping carts
 We can create, design and manage your social media elements and also provide you the know hows
 It's not all about great designs for your website to be found online. We can get your website found.
 We can design your all your graphic assets from logos, stationery to illustrations
 We can design your all your graphic assets from logos, stationery to illustrations